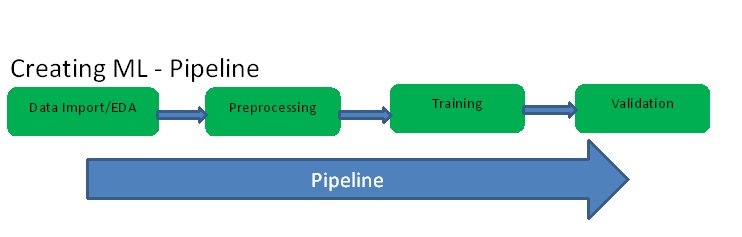
Probability is about how Likely something is to occur, or how likely something is true.
Probability = Ways / Outcomes
Probability is about how Likely something is to occur, or how likely something is true.
Probability = Ways / Outcomes
Data governance is a collection of processes, roles, policies, standards, and metrics that ensure the effective and efficient use of information that enables an organization to achieve its goals.
A data governance policy is a document that formally outlines how organizational data will be managed and controlled. A few common areas covered by data governance policies are:
Addressing all of these points requires a right combination of people skills, internal processes, and the appropriate technology.
Data stewards are individual team members responsible for overseeing data and implementing policies and processes. Data stewards are typically subject matter experts who are familiar with the data used by a specific business functions or department. These roles are typically filled by IT or data professionals with expertise on data domains and assets. Data stewards may also play a role as engineers, quality analysts, data modelers, and data architects. They also ensure the fitness of data elements, both content and metadata, administer the data and ensure compliance with regulations.
Data governance is a strategy used while data management is the practices used to protect the value of data. When creating a data governance strategy, you incorporate and define data management practices. Data governance examples and policies direct how technologies and solutions are used, while management leverages these solutions to achieve tasks.
A data governance framework is a structure that helps an organization assign responsibilities, make decisions, and take action on enterprise data. Data governance frameworks can be classified into three types:
Essential elements of a data governance framework include:
While many companies create data governance frameworks independently, there are several standards which can help formulate a data governance framework, including COBIT, ISO/IEC 38500, and ISO/TC 215.
Data and information governance helps organizations achieve goals such as:
A data governance strategy informs the content of an organization’s data governance framework. It requires you to define, for each set of organizational data:
Data governance policies are guidelines that you can use to ensure your data and assets are used properly and managed consistently. These guidelines typically include policies related to privacy, security, access, and quality. Guidelines also cover the roles and responsibilities of those implementing policies and compliance measures.
The purpose of these policies is to ensure that organizations are able to maintain and secure high-quality data. Governance policies form the base of your larger governance strategy and enable you to clearly define how governance is carried out.
Data governance operations are performed by a range of organizational members, including IT staff, data management professionals, business executives, and end users. There is no strict standard for who should fill data governance roles but there are standard roles that organizations implement.
Chief data officers are typically senior executives that oversee your governance program. This role is responsible for acting as a program advocate, working to secure staffing, funding, and approval for the project, and monitoring program progress.
Data governance managers may be covered by the chief data officer role or may be separate staff. This role is responsible for managing your data governance team and having a more direct role in the distribution and management of tasks. This person helps coordinate governance processes, leads training sessions and meetings, evaluates performance metrics, and manages internal communications.
The data governance committee is an oversight committee that approves and directs the actions of the governance team and manager. This committee is typically composed of data owners and business executives.
They take the recommendations of the data governance professionals and ensure that processes and strategies align with business goals. This committee is also responsible for resolving disputes between business units related to data or governance.
Managing data governance principles effectively requires creating a business function, similar to human resources or research and development. This function needs to be well defined and should include the following process steps:
Evaluating the maturity of your governance strategies can help you identify areas of improvement. When evaluating your practices, consider the following levels.
Level 0 organizations have no awareness of data governance meaning and no system or set of policies defined for data. This includes a lack of policies for creating, collecting, or sharing information. No data models are outlined and no standards are established for storing or transferring data.
Action items
Strategy planners and system architects need to inform IT and business leaders about the importance and benefits of data governance and Enterprise Information Management (EIM).
Level 1 Organizations understand that they are lacking data governance solutions and processes but have few or no strategies in place. Typically IT and business leaders understand that Enterprise Information Management (EIM) is important but have not taken action to enforce the creation of governance policies.
Action Items
Planners and architects need to begin determining organization needs and developing a strategy to meet those needs.
Level 2 organizations understand the importance and value of data and have some policies in place to protect data. Typically, the practices used to protect data by these organizations are ineffective, incomplete, or inconsistently enforced.
Action items
Management teams need to push for consistency and standardization for the implementation of policies.
Level 3 organizations are actively working to apply governance, including implementing proactive measures. Data governance is a part of all organizational processes. However, there is typically no universal system for governance. Instead, information owners are responsible for management.
Action items
Organizations need to evaluate governance at the departmental level and centralize responsibilities.
Level 4 organizations have developed and consistently implemented governance policies and standards. These organizations have categorized their data assets and can monitor data use and storage. Additionally, oversight of governance is performed by an established team with roles and responsibilities.
Action Items
Teams should actively track data management tasks and perform audits to ensure that policies are applied consistently.
Level 5 organizations have achieved reliable data governance structures. They may have individuals in their teams with data governance certifications and have established experts. These organizations can effectively leverage their data for competitive advantage and improvements in productivity.
Action items
Teams should work to maintain governance and verify compliance. Teams may also actively investigate methods for improving proactive governance. For example, by researching best practices for specific governance cases, like big data governance.
A data governance initiative must start with broad management support and acceptance from stakeholders who own and manage the data (called data custodians).
It is advisable to start with a small pilot project, on a set of data which is especially problematic and in need of governance, to show stakeholders and management what is involved, and demonstrate the return on investment of data governance activity.
When rolling out data governance across the organization, use templates, models and existing tools when possible in order to save time and empower organizational roles to improve quality, accessibility and integrity for their own data. Evaluate and consider using data governance tools which can help standardize processes and automate manual activities.
Most importantly, build a community of data stewards willing to take responsibility for data quality. Preferably, these should be the individuals who already create and manage data sets, and understand the value of making data usable for the entire organization.
This data visualization is based on Google search console from mobile devices / Computers / Tablets.
Data Studio allows you to create beautiful dashboards full of charts quickly and easily. It’s very easy to use for sharing reports and dashboards with your internal/external teams if they have a Google account. It enables collaboration within business groups.
With Data Studio, you can connect, analyze, and present data from different sources.
During brain storm sessions, the identified lead may want to initiate the necessary tools for each participant to bring along including a piece of paper and pencils to take down notes.
Brain storming is one of the tools recommended by 6-Sigma on how to reduce cluttering in order to accelerate with the documentation of the necessary agreeable requirements after presentations to Stakeholders of this project.
Brainstorming is a method for generating ideas in a group situation. Teams and departments should use brainstorming when:
Provide a time limit for the session. Generally 30 minutes is sufficient. Identify one or more recorders to take down notes during the session. The recorders’ job is to write all ideas down (where everyone can see them, such as on a flipchart or overhead transparency) as they are voiced.
Choose either:
End the session when – everyone has had a chance to participate, no more ideas are being offered, you have made a “last call” for ideas, remember to thank all the participants.
During brain storming sessions, it’s always prudent and necessary to capture suggestions and feedbacks which might be related to existing or identified problems from our users’ population including internal customers to these applications.
I recently ran across a tenacity, persistence, intransigence and inflexible condition which existed within COMMERCIAL ACCOUNT SYSTEMS that needed to be address immediately to reduce and avoid misunderstanding, misleading, miscommunication within the entire BANKING SYSTEMS and other partnership or business-to-business INVENTORY SYSTEMS where the naming of tables schemas within their RDBMS created abnormalities how the data, transaction threads were processed.
At first the problem appeared to be easy and solvable but the more I thought about the definition of the tables and operating sources where these data would be coming from, I realized it was going to involve multiple parties and experts from different subject areas of BANKING ACCOUNTING SYSTEMS.
Stepping through the process, the necessary requirements and data collections were the initial phase to identify where to start and also, how we could easily provide and satisfy our customer’s needs using JIT while the rest of the project is handled in a full lifecycle methodology when faced with issues like this.
In this situation a CHANGE MANAGEMENT (Maintenance Request) record and subsequence records were necessary, and meetings held with top management to scope, plan, dissect and forecast the project.
Within the IMS group, the following tables were identified for table names and definitions changes to reflect the actual nature of the data.
COMMERCIAL ACCOUNT SYSTEM consist of profitable, invested, credited, debited, assets and liabilities records including book entries and ledger transaction records.
The table names are misleading and have been interruptive, disturbing and a nuisance to business users who have been given the exposure of EIS nomenclature, categorization and architectural infrastructure without the complete understanding of why, where, and when the transactions actually occurred.
The reasoning behind this change is to eliminate misunderstanding both in their users’ communities and IMS groups. The architecture team should be aware of these changes and Management Initiatives should include, involve the planning, scoping, forecasting and implementation schedules of the project.
This project would need to use the normal full life cycle through implementation; and all necessary metadata changes should be reflective and maintained within the DATA DICTIONARY REPOSITORY accordingly following the DATA STANDARDS requirements.
Majority of the effort would occur in the Design phase of the project, coordinated by a dedicated Data Architect assigned to the project.
The COMMERCIAL_LOAN_TH tables needs change along with the ACCT_TYPE_CD value reflecting the nature of the data stored within these tables in the COMMERCIAL ACCOUNT SYSTEMS.
In the interim, JIT adhocs should be applied to apprehend the necessary changes.
OLD | NEW |
COMMERCIAL_LOAN | COMMERCIAL |
COMMERCIAL_LOAN_TH | COMMERCIAL_TH |
COMMERCIAL_LOAN_STMT_TH | COMMERCIAL_STMT_TH |
ACCT_TYPE_CD (CLA) | ACCT_TYPE_CD (CMA) |
In short, the word LOAN should be removed and drop out of the identified table names.
No record length data should be affected with this MR(Maintenance Request). But ALL of the systems where these table names and ACCT_TYPE_CD are stated as those under the OLD column should be changed as recommended to reflect the names and values under the NEW column.
Initial research work is needed to take place to identify ALL the affected tables while team meetings are scheduled, organized and led by team leaders to make sure all necessary requirements are met, identified and captured by developers performing these search. The preliminary data investigation should include and involve database analysts and Database Administrators to go through all the connectivity systems and platforms, making sure all necessary tables, databases, extracts, ETLs are listed on the requirement documentation.
Possible extension of this project may result in cases where certain commercial threads (transaction records) as listed on the table definitions are not past into the COMMERCIAL ACCOUNT SYSTEMS. Extracts should be sources from those operating systems into the COMMERCIAL ACCOUNT SYSTEMS using the new ACCT_TYPE_CD as CMA.
Figure 1.3.1 Related IO of Commercial Banking Systems
Definitions for Aggregating Online Transactions as related to Commercial Account Systems (CMA).
By collecting input from online transactions systems such as SUNGUARD, FINTECH, COINBASE and other PAYMENT Systems.
Summarizing transaction records:
Amount values should reflect POSITIVE or NEGATIVE as reported on the INPUT datafiles. These may generate NEW COLUMNS and an EXPANSION of RECORD LENGTH resulting to CHANGE on TABLESPACE sizing and STORAGE capabilities.
Both Design and Production teams were notified, alert and scheduled recurring meetings to mitigate any such changes coming down the pipe (Waterfall methodology) during R&D (Research and Development).
Apply scheduled RUNS on summarized records to Extract – Transform – Load and ADD to CUSTOMER ACCOUNTS depending on the ACCT_TYPE_CD. ETL input transaction records from SUNGUARD, FINTECH, COINBASE depending on the CUSTOMER. Input data may be received DAILY; WEEKLY; BIWEEKLY; MONTHLY.
Both AMOUNT and CHARGES should be summarized before scheduled RUNS.
Deduct CHARGES from summarize AMOUNTS. SEND INPUT files INTO ACH DEPARTMENT depending on the ACCT_TYPE_CD. Records are then stored on the following tables – PI, DDA, TDA, CMA, INV based on the specific account type.
Keep in mind that as we walked through the different phases of the project, we all realized, it was very close to home as had originally imagined. Another condition to the puzzle was, with ANY BALANCE to the client, customer, entity or institution record, a MONTHLY STATEMENT should be sent to the rightful OWNERS.
These processes would help to limit the number of accounts per USER. Again, ACCOUNT NUMBER REUSE is to allow previous OWNERS to have their same ACCOUNT NUMBERS.
As we drill down to the dying issue, I discovered some of their systems did not have either these columns SECURITY_TYPE_CD, SECURITY_CODE_NM nor the following code and name values for the above corresponding columns.
These classification and categorization of investment products were very important to derive with the mapping of these accounts as depicted in figure 1.3.1.
SECURITY_TYPE_CD | SECURITY_CODE_NM | |
ACH | Automated Clearing House | |
ICS | Investment Credit Securities | |
WMD | Winning Money Distribution | |
SPG | Structured Product Group | |
CCO | Collateralized Credit Obligations | |
IPN | Index Profitability Notes | |
PPP | Profitability Pass-thru Payments | |
MBSO | Monetary Bypass Systems to Owners | |
CDO | Credit Deductible Obligations |
Table 1.3.1.1 Security Type Code valid values.
Most corporations rely, depend and thrust subtle resolutions to their corporate financial statements without actually taken the burden to reflect on certain factors such as dividends when their company stocks (shares) splits.
Splits do not occur in most cases on regulated timing / scheduled but base on their corporation, company or incorporation’s performance / merger procedures such as convergence, absorption, mergence or combination of multiple corporations to restructure overheads by the owner(s), reducing the number of officers hence busting the overall performance by identifying newly improve methodology to accumulate profitability per investors / owners of either or companies or shares.
Resolutions generally indicated by Financial Adaptive Finite Quantitative (FAFQ) platforms may not indicate the In-House Financial Statements for such corporations.
The DEBT amount on total number of available shares multiplied by the price per share (P/S) should NOT be regarded when considering performance of any corporation. Neither should the company’s bottom line performance be evaluated by considering the outstanding shares.
When considering the total number of shares including outstanding shares, the figure associated with or display on the “DEBT” column should be regarded as positive. In this case, trailing issues regarding the distribution of profitability’s should not be apparent or questionable to its holders.
During corporations, companies, or incorporated stock (shares) splits, the dividend is usually the inverse (vice versa) of the split ratio. In case the value is very high compare to the value per share, an additional amount of share could be distributed per holders / employees.
Let’s go through a simple example for instance GOOGLE, Inc with a share price of $2260.00 and had to split 20:1; the resulting table is a typical example on how the dividends would be reflected and further distributed.
EQUITY | CURRENT SHARE PRICE | SPLIT RATIO | RESULTING SHARE PRICE |
GOOG | $2260.00 | 20:1 | $113.00 |
FOR DIVIDEND | |||
CURRENT DIVIDEND VALUE | RATIO (VICE VERSA) | RESULTING DIVIDEND VALUE | |
IF | $2.00 | 20:1 | $0.10 |
The shareability, distribution and usability of the resulting dividend value would eventually drop down the final reporting value. At that instance, the board of directors is deemed to decide what value to agree on as dividend which should not be ≤ $2.00/20 at a minimum.
It’s always interesting when such minimal arithmetic consumes our precious time, while socializing over the latest pastries, traveling from unnecessary distance just to decide when to publicize such crucial information as pertinent to stock holders as well as employees.
Data Studio is use for data visualization and as a reporting tool. It was created by Google in 2016. And it has gained a lot of traction from Data Scientists, Analysts, and Sales and Marketing Experts.
Data Studio is completely free. There’s no paid version of it. You can use it as an alternative to paid reporting tools such as Tableau and Power BI.
Data Studio is cloud-based:
It’s accessible through any browser and an internet connection. The reports you create are saved automatically into Google Data Studio framework, so they’re available anytime and anywhere. No worries about losing the files.
There are many pre-built templates in Data Studio, allowing you to create beautiful dashboards full of charts quickly and easily. It’s very easy to share reports and dashboards with your internal / external teams if they have a Google account. It enables collaboration within business groups.
With Data Studio, you can connect, analyze, and present data from different sources. You don’t even need to be tech-savvy or know programming languages to get started with Data Studio.
Google Data Studio: Data sources and connectors:
Every time you want to create a report, first, you’ll need to create a data source. It’s important to note that data sources are not your original data. To clarify and avoid confusion, see the explanation below:
When Data Studio was first released, there were only six Google-based data sources you could connect to. But a lot has changed since then!
As of this writing, there are 400+ connectors to access your data from 800+ datasets. Besides Google Connectors, there are also Partner Connectors (third-party connectors).
In the example below we’ll go through US Office Equipment Sample Dataset to visualize different charts representing the data.
File Upload / Locate File:
CSV files are called Unmapped data because their contents are unknown in advance.
Analyze and Visualize the Data:
Quick Steps to Set Up Data Visualization on Google Data Studio:
Conclusion:
Congratulations! We just went through how to create a Business Intelligence BI dashboard using Google Data Studio for visualizing and exploring a sample Office Equipment dataset.
Data Studio allows you to create beautiful dashboards full of charts quickly and easily. It’s very easy to use for sharing reports and dashboards with your internal/external teams if they have a Google account. It enables collaboration within business groups.
With Data Studio, you can connect, analyze, and present data from different sources. You don’t even need to be tech-savvy or know programming languages to get started with Data Studio.
Cloud ML:
The Cloud ML Engine is a hosted platform to run machine learning training jobs and predictions at scale. The service can also be used to deploy a model that is trained in external environments. Cloud ML Engine automates all resource provisioning and monitoring for running the jobs.
The cloud makes intelligent capabilities accessible without requiring advanced skills in artificial intelligence or data science. AWS, Microsoft Azure, and Google Cloud Platform offer many machine learning options that don’t require deep knowledge of AI, machine learning theory, or a team of data scientists.
Cloud AI:
The AI cloud, a concept only now starting to be implemented by enterprises, combines artificial intelligence (AI) with cloud computing. An AI cloud consists of a shared infrastructure for AI use cases, supporting numerous projects and AI workloads simultaneously, on cloud infrastructure at any given point in time.
Artificial intelligence (AI) assists in the automation of routine activities within IT infrastructure, which increases productivity. The combination of AI and cloud computing results in an extensive network capable of holding massive volumes of data while continuously learning and improving.
Cloud ML | Cloud AI |
The Cloud ML Engine is a hosted platform to run machine learning training jobs and predictions at scale. | An AI cloud consists of a shared infrastructure for AI use cases, supporting numerous projects and AI workloads simultaneously, on cloud infrastructure at any given point in time. |
The service can also be used to deploy a model that is trained in external environments. Cloud ML Engine automates all resource provisioning and monitoring for running the jobs. | Enterprises use the power of AI-driven cloud computing to be more efficient, strategic, and insight-driven. AI can automate complex and repetitive tasks to boost productivity, as well as perform data analysis without any human intervention. IT teams can also use AI to manage and monitor core workflows. |
The pay-per-use model further makes it easy to access more sophisticated capabilities without the need to bring in new advanced hardware. | Cloud AI Platform is a service that enables user to easily build machine learning models, that work on any type of data, of any size. |
This storage service provides petabytes of capacity with a maximum unit size of 10 MB per cell and 100 MB per row. 1024 Petabytes of data. | 1024 Petabytes of data. The larger the RAM the higher the amount of data it can handle hence faster processing. 16GB RAM and above is recommended for most deep learning tasks. |
High Flexibility and Cost Effective. | Seamless Data Access. High Flexibility and Cost Effective. |
Cloud ML Engine is used to train machine learning models in TensorFlow and other Python ML libraries (such as scikit-learn) without having to manage any infrastructure. | In Artificial Intelligence, the Decision Tree (DT) model is used to arrive at a conclusion based on the data from past decisions. |
Cloud DLP – Data Loss Prevention provides tools to classify, mask, tokenize, and transform sensitive elements to help you better manage the data that you collect, store, or use for business or analytics. | Cloud DLP – Data Loss Prevention provides tools to classify, mask, tokenize, and transform sensitive elements to help you better manage the data that you collect, store, or use for business or analytics. |
The cloud makes intelligent capabilities accessible without requiring advanced skills in artificial intelligence or data science. | The cloud makes intelligent capabilities accessible without requiring advanced skills in artificial intelligence or data science. |
Google, Amazon, Microsoft, and IBM | Google, Amazon, Microsoft, and IBM |
ML’s aim is to improve accuracy without caring for success. | The goal of AI is to increase the chances of success. |
ML is the way for the computer program to learn from experience. | AI is a computer program doing smart work. |
The ML’s goal is to keep learning from data to maximize the performance. | The future goal of AI is to stimulate intelligence for solving highly complex programs. |
ML allows the computer to learn new things from the available information. | AI involves decision-making. |
ML looks for the only solution. | AI looks for optimal solutions. |
ML and AI:
Even though many differences exist between ML and AI, they are closely connected. AI and ML are often viewed as the body and the brain. The body collects information, the brain processes it. The same is with AI, which accumulates information while ML processes it.
Conclusion:
AI involves a computer executing a task a human could do. Machine learning involves the computer learning from its experience and making decisions based on the information. While the two approaches are different, they are often used together to achieve many goals in different industries.
What is Correlation?
Correlation is a statistical measure that expresses the extent to which two variables are linearly related (meaning they change together at a constant rate). It’s a common tool for describing simple relationships without making a statement about cause and effect.
Why is Correlation important?
Once correlation is known it can be used to make predictions. When we know a score on one measure we can make a more accurate prediction of another measure that is highly related to it. The stronger the relationship between/among variables the more accurate the prediction.
Related Articles:
In this example we’ll perform different Data Visualization charts on Population Data. There’s an easy way to create visuals directly from Pandas, and we’ll see how it works in detail in this tutorial.
To easily create interactive visualizations, we need to install Cufflinks. This is a library that connects Pandas with Plotly, so we can create visualizations directly from Pandas (in the past you had to learn workarounds to make them work together, but now it’s simpler) First, make sure you install Pandas and Plotly running the following commands on the terminal:
Install the following labraries in the this order – on Conda CMD prompt pip install pandas pip install plotly pip install cufflinks
import pandas as pd import cufflinks as cf from IPython.display import display,HTML cf.set_config_file(sharing='public',theme='ggplot',offline=True)
In this case, I’m using the ‘ggplot’ theme, but feel free to choose any theme you want. Run the command cf.getThemes() to get all the themes available. To create data visualization with Pandas in the following sections, we only need to use the syntaxdataframe.iplot().
The data we’ll use is a population dataframe. First, download the CSV file from Kaggle.com, move the file where your Python script is located, and then read it in a Pandas dataframe as shown below.
#Format year column to number with no decimals df_population = pd.read_csv('documents/population/population.csv')
#use a list of indexes: print(df_population.loc[[0,10]])
country year population 0 China 2020.0 1.439324e+09 10 China 1990.0 1.176884e+09
print(df_population.head(10))
country year population 0 China 2020.0 1.439324e+09 1 China 2019.0 1.433784e+09 2 China 2018.0 1.427648e+09 3 China 2017.0 1.421022e+09 4 China 2016.0 1.414049e+09 5 China 2015.0 1.406848e+09 6 China 2010.0 1.368811e+09 7 China 2005.0 1.330776e+09 8 China 2000.0 1.290551e+09 9 China 1995.0 1.240921e+09
This dataframe is almost ready for plotting, we just have to drop null values, reshape it and then select a couple of countries to test our interactive plots. The code shown below does all of this.
# dropping null values df_population = df_population.dropna()
# reshaping the dataframe df_population = df_population.pivot(index="year", columns="country", values="population")
# selecting 5 countries df_population = df_population[['United States', 'India', 'China', 'Nigeria', 'Spain']]
print(df_population.head(10))
country United States India China Nigeria Spain year 1955.0 171685336.0 4.098806e+08 6.122416e+08 41086100.0 29048395.0 1960.0 186720571.0 4.505477e+08 6.604081e+08 45138458.0 30402411.0 1965.0 199733676.0 4.991233e+08 7.242190e+08 50127921.0 32146263.0 1970.0 209513341.0 5.551898e+08 8.276014e+08 55982144.0 33883749.0 1975.0 219081251.0 6.231029e+08 9.262409e+08 63374298.0 35879209.0 1980.0 229476354.0 6.989528e+08 1.000089e+09 73423633.0 37698196.0 1985.0 240499825.0 7.843600e+08 1.075589e+09 83562785.0 38733876.0 1990.0 252120309.0 8.732778e+08 1.176884e+09 95212450.0 39202525.0 1995.0 265163745.0 9.639226e+08 1.240921e+09 107948335.0 39787419.0 2000.0 281710909.0 1.056576e+09 1.290551e+09 122283850.0 40824754.0
Let’s make a lineplot to compare how much the population has grown from 1955 to 2020 for the 5 countries selected. As mentioned before, we will use the syntax df_population.iplot(kind=’name_of_plot’) to make plots as shown below.
df_population.iplot(kind='line',xTitle='Years', yTitle='Population', title='Population (1955-2020)')
We can make a single barplot on barplots grouped by categories. Let’s have a look.
Let’s create a barplot that shows the population of each country by the year 2020. To do so, first, we select the year 2020 from the index and then transpose rows with columns to get the year in the column. We’ll name this new dataframe df_population_2020 (we’ll use this dataframe again when plotting piecharts)
df_population_2020 = df_population[df_population.index.isin([2020])] df_population_2020 = df_population_2020.T
Now we can plot this new dataframe with .iplot(). In this case, I’m going to set the bar color to blue using the color argument.
df_population_2020.iplot(kind='bar', color='blue', xTitle='Years', yTitle='Population', title='Population in 2020')
Now let’s see the evolution of the population at the beginning of each decade.
# filter years out df_population_sample = df_population[df_population.index.isin([1980, 1990, 2000, 2010, 2020])] # plotting df_population_sample.iplot(kind='bar', xTitle='Years', yTitle='Population')
Naturally, all of them increased their population throughout the years, but some did it at a faster rate.
Boxplots are useful when we want to see the distribution of the data. The boxplot will reveal the minimum value, first quartile (Q1), median, third quartile (Q3), and maximum value. The easiest way to see those values is by creating an interactive visualization. Let’s see the population distribution of the China.
df_population['China'].iplot(kind='box', color='green', yTitle='Population')
Let’s say now we want to get the same distribution but for all the selected countries.
df_population.iplot(kind='box', xTitle='Countries', yTitle='Population')
As we can see, we can also filter out any country by clicking on the legends on the right.
A histogram represents the distribution of numerical data. Let’s see the population distribution of the USA and Nigeria.
df_population[['United States', 'Nigeria']].iplot(kind='hist', xTitle='Population')
Let’s compare the population by the year 2020 again but now with a piechart. To do so, we’ll use the df_population_2020 dataframe created in the “Single Barplot” section. However, to make a piechart we need the “country” as a column and not as an index, so we use .reset_index() to get the column back. Then we transform the 2020 into a string.
# transforming data df_population_2020 = df_population_2020.reset_index() df_population_2020 =df_population_2020.rename(columns={2020:'2020'}) # plotting df_population_2020.iplot(kind='pie', labels='country', values='2020', title='Population in 2020 (%)')
Although population data is not suitable for a scatterplot (the data follows a common pattern), I would make this plot for the purposes of this guide. Making a scatterplot is similar to a line plot, but we have to add the mode argument.
df_population.iplot(kind='scatter', mode='markers')
Whaola! Now you’re ready to make your own beautiful interactive visualization with Pandas.
Job Description:
• Experience with MES implementation
• Technical architect of small and medium projects.
• Expert in digital manufacturing space end to end encompassing both business process understanding and technical expertise
• Delivers solution including architecture, process diagrams, technical interfaces, data modelling, integration planning, detailed build estimates
• Design, integration and delivery of the technology architecture for digital manufacturing across all its domains
• Translates non-functional and functional requirements into end-to-end solution
• Coordinates medium to large solution architecture implementations while leading design variances based upon business needs
• Collaborates with other Solution Architects, Enterprise Architecture BI Designers to make sure that the solution fits within enterprise context
• Expertise in Technical Analysis, Design, Development, Maintenance & Database Administration of Real-time systems over Internet & Intranet
• Expertise in Analyzing & Defining Architecture for Components.
Have strong aptitude in understanding client requirement in the pre-design stage and development
A data governance framework organizes people, processes and technologies together to create a paradigm of how data is managed, secured, and distributed. But the path to a data governance framework often seems difficult to embark upon. Here are three steps to help you get started:
Your challenge is to overcome these obstacles by bringing clarity, transparency, and accessibility to your data assets. You have to do this wherever this data warehouse resides: within enterprise apps like Salesforce.com, Microsoft Dynamics, or SAP; a traditional data warehouse; or in a cloud data lake. You need to establish proper data screening so you can make sure you have the entire view of data sources and data streams coming into and out of your organization.
While step 1 helped to ensure that the incoming data assets are identified, documented and trusted, now it is time to organize the assets for massive consumption by an extended network of data users who will use it within the organization.
Now that your data is fully under control, it is time to extract all its value by delivering it at scale to a wide audience of authorized humans and machines. In the digital era, scaling is a lot about automation. In the second step of this approach, we saw how important it was to have people engaged in the data governance process, but the risk is that they become the bottleneck. That’s why you need to augment your employees’ skills, free them from repetitive tasks, and make sure that the policies that they have defined can be applied on a systematic basis across data flows.
All of the topics above cover key focus areas to be considered when building a data governance framework. Building the framework is important — but enforcing it is key. A data governance process must be created on the heels of the framework to ensure success. Some organizations create a data governance council — a single department that controls everything. Smaller organizations may appoint a data steward to manage the data governance processes. Once your data governance framework is in place and is being rolled out, it needs to be communicated to all areas of the business. Make it resonate with employees by demonstrating how this framework will help carry out your company’s vision for the future. As with any new policy or standard, employee awareness and buy-in is important to success; and this holds true with the data governance framework.
There is certainly no shortage of data, and building a data governance framework is a challenge many enterprises face. With any Cloud base systems, you can build a systematic path to get to the data you can trust. A path that is repeatable and scalable to handle the seemingly unending flow of data to make it your most trusted asset.
Speech recognition, decision-making, and visual perception are some features that an ‘AI’ possess. The main goal of artificial intelligence has always been for these machines to be able to learn, reason, and perceive as human beings with little or no human intervention. But humans are always going to be needed to observe and supply equipment necessary to perform the processes.
Machines are driven by software packages that stores, sorts, processes complex datasets based on entities relationships feed by humans to perform event-driven actions that reduces human interventions.
AI enables an unprecedented ability to analyze enormous data sets and computationally discover complex relationships and patterns. AI, augmenting human intelligence, is primed to transform the scientific research process, unleashing a new golden age of scientific discovery in the coming years.
With artificial intelligence automating all kinds of work, we can think of a more comfortable future for ourselves that will create new jobs. According to a report on the Future of Jobs by World Economic Forum, AI will create 80 million new artificial intelligence jobs world wide by 2024.
You must be logged in to post a comment.